Can a Microstructure AI Understand Welds? A One-Day Experiment
Dr. ir. Michael Sluydts, CEO & Scientific Director — ePotentia
I was recently invited to give a closing talk at the IIW (International Institute of Welding) Workshop on AI, hosted at OCAS NV in Belgium. The organizers asked for a broader perspective: how might AI help with welding quality and fatigue analysis in the future? Rather than presenting polished results from a multi-year study, I decided to try something more interesting – I gave myself a one-day challenge. Could a foundation model trained on steel microstructures, with zero retraining, do something useful on welding images it had never seen before?
The answer turned out to be a surprisingly compelling “yes.” Here’s the story.
Foundation Models: The Big Picture
The AI landscape is rapidly converging on foundation models — large models pre-trained on massive datasets that can then be applied to new tasks with minimal or no additional training. The multimodal ones we all know (think GPT-4, Gemini) combine text and images and know an impressive amount about the world. An ideal foundation model for materials science would combine micrographs, diffraction data, composition maps, processing parameters, and mechanical properties into a single learned representation.
We’re not there yet. But we’ve been building toward it.
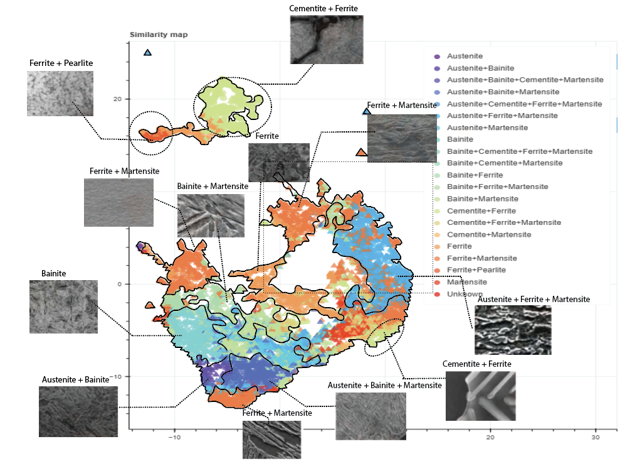
A similarity map produced by our self-supervised model on steel microstructure data. Each point is a micrograph; nearby points have similar visual features. The model learned to organize ferrite, martensite, bainite, pearlite, and their combinations – without ever being told what those phases are.
What We Built in AID4GREENEST
In the EU Horizon Europe project AID4GREENEST, we’ve been developing self-supervised vision models for steel microstructures together with Ghent University. These models power MicrostructureDB, our platform for organizing and exploring metallurgical image data.
The core problem we’re solving is a practical one: historical microstructure data is abundant but messy. Labels are inconsistent, image quality varies wildly, and manual curation takes forever. Self-supervised learning sidesteps this by learning visual representations directly from the images themselves – no labels required. The result is a model that understands what makes microstructures visually similar or different, and can organize thousands of images into a meaningful map where similar structures cluster together.
We’ve also developed diffusion models to generate synthetic microstructure images. Why? Because even after you organize your data, rare microstructures remain rare. Synthetic data generation can help fill those gaps.
General-Purpose AI vs. Domain-Specific Models
This brings up an important question: do we even need specialized models? Can’t Gemini or GPT-4 just handle microstructures?
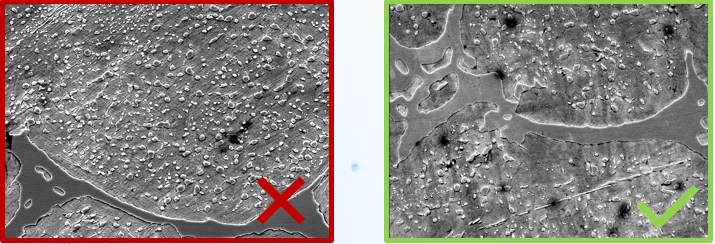
To test this, I asked Gemini to generate a steel microstructure image. It produced something that knew the right vocabulary — spheroidite, cementite particles — but the result didn’t look like an actual micrograph. It was an artist’s impression, not a scientific image.
Gemini’s attempt at generating a steel microstructure. It knows the important features conceptually, but the output doesn’t pass muster as a real micrograph, it maintains a biological feel.
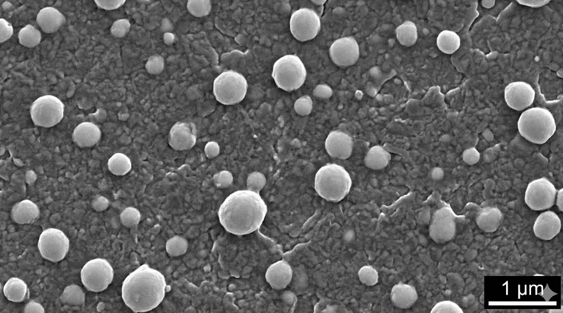
Our own domain-specific diffusion models, trained on actual micrographs, produce far more realistic results — though they take dedicated effort to build and validate.
Left: A synthetic microstructure. Right: a real microstructure from the public ultra-high carbon steel database (UHCSDB).
Interestingly, welds are more common on the internet than SEM micrographs, so Gemini does a much better job generating those. It produced a quite convincing T-joint fillet weld image.
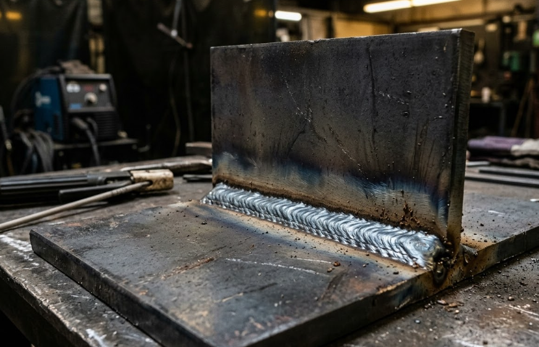
Gemini’s synthetic weld — looks convincing, right?
When I asked Gemini to assess its own creation, it initially described it as a real, high-quality TIG weld with good travel speed control and clean heat-affected zone colors. Only when I pressed it did it start noticing the telltale signs of a synthetic image: the bead ripple pattern is too uniform, the spatter looks decorative rather than physically ejected, the HAZ gradient is textbook-perfect, and the background welding machine is conveniently blurry and generic. A useful reminder that LLMs can be confidently wrong about their own outputs — and that critical evaluation still requires domain expertise.
The One-Day Challenge: Welding Meets Microstructure AI
So here’s where it gets fun. I downloaded a publicly available welding image dataset, appropriately called The Welding Dataset – a collection of macroscopic weld photographs labeled as good, bad, or defective. It’s the kind of messy, real-world dataset that’s perfect for stress-testing a model: images from different sources, varying quality, some with text overlays, some extracted from video frames, and multiple sub-datasets mixed together.
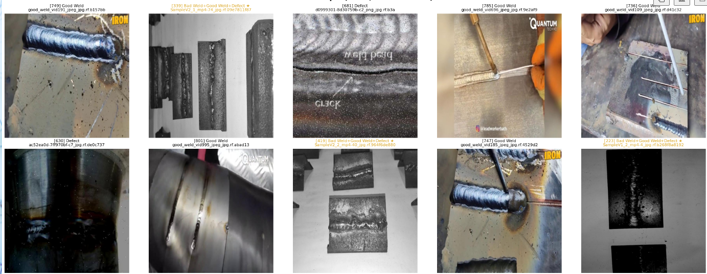
A random sample from the welding dataset. Notice the variety: video frames, text overlays, watermarks, different lighting and angles. This is what real-world data looks like.
I took our microstructure foundation model – trained exclusively on steel micrographs – and ran the welding images through it without any retraining. The model had never seen a macroscopic weld photograph in its life. But here’s the key insight: because it was trained on grayscale images with fine structural details, it had learned to pay attention to exactly the kinds of visual features that matter in weld surfaces too – texture, grain, edges, patterns.
What the Model Saw
The 2D map projection of the dataset revealed four clear clusters. Three of them turned out to be groups of near-identical video frames (not very interesting). The fourth cluster was the most revealing: a mix of images from the general datasets where defective welds separated clearly from good ones, with “bad” welds intermixed — exactly what you’d expect, since the boundary between “bad” and “defective” is often subjective.
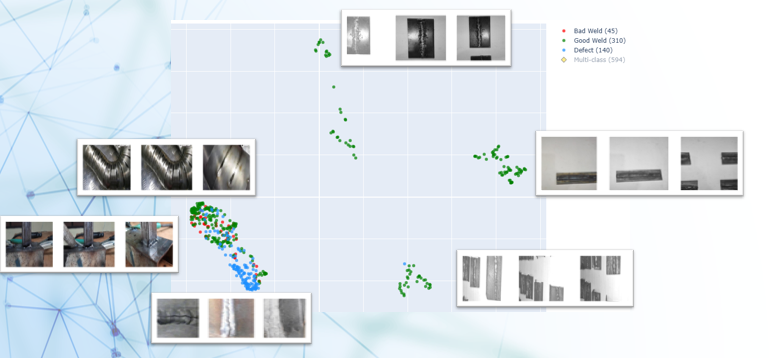
The model’s map of the welding dataset — no retraining, no welding-specific labels. The microstructure training taught it to look at fine details in grey sections, and that transfers directly.
Image search worked remarkably well too. Querying with a colorful, curved TIG weld returned semantically similar results: other curved, colored welds from different sources.
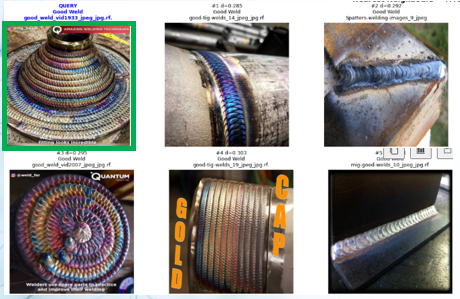
Semantic image search in action. The query image (top-left) finds visually similar welds across different sub-datasets — the model understands “curved colorful weld” as a concept.
Anomaly detection – finding the most isolated points in the representation space – surfaced exactly the kind of oddities you’d want to flag: images with unusual features, text overlays, or non-standard compositions. In practice though this dataset is so chaotic, that many things could be seen as an outlier! In a cleaner dataset, this would be a powerful tool for finding genuinely unusual welds.
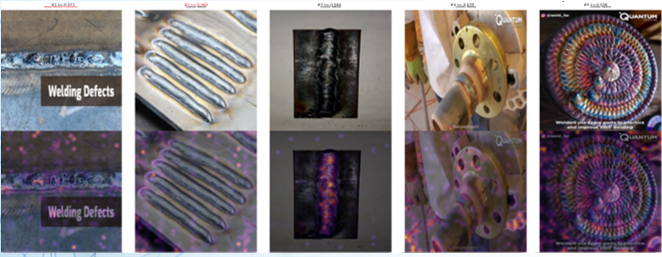
Anomaly detection surfaces the outliers. In a chaotic dataset, anything could be an outlier — but the attention maps show the model is focusing on relevant structural features, not just noise.
Testing the Synthetic Weld
Remember Gemini’s convincing synthetic weld? I ran it through the model to see where it would land. It fell into the mixed cluster, in the non-defect region, right on the edge – not fully inside the distribution of real welds. All five of its nearest neighbors were “bad” welds, which makes a certain kind of sense: the synthetic image depicts a T-joint, and so do many of the bad weld examples in that region. The model correctly identified the joint type as the organizing principle. If the synthetic image had fallen completely outside the clusters however, that would have been a red flag for its realism. Instead, it lives on the bad boundary – plausible but not quite real.
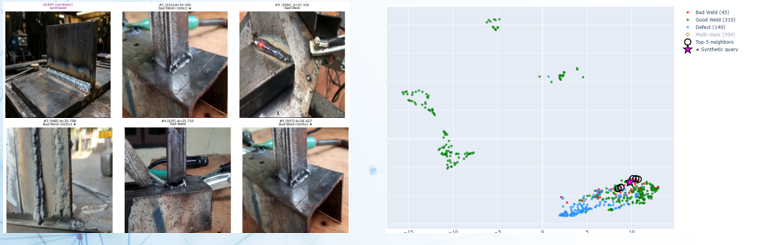
Where does the synthetic weld land? On the edge of the real distribution, with T-joint images as its nearest neighbors. The model recognizes the joint type but places it at the periphery — not fully “in” the data.
From Exploration to Classification in Minutes
As a final test, I built a k-nearest-neighbor (k=5) classifier on top of the foundation model’s representations. No neural network fine-tuning, no training loop – just a majority vote among the five closest images in the representation space.
The result: 86% accuracy on the three-class problem (good / bad / defect), compared to a 63% majority-class baseline. Not state-of-the-art, but remarkable for a model that was never trained on welding data, using the simplest possible classifier, assembled in minutes. It’s exactly the kind of rapid feasibility test that tells you whether deeper investment in data collection and model development is worthwhile.
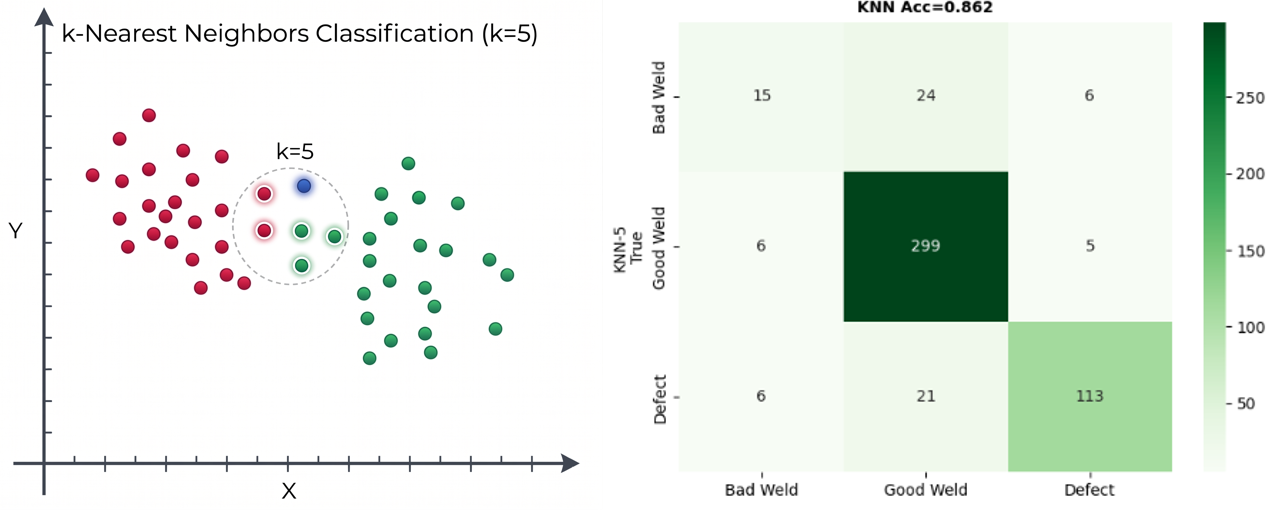
A k=5 nearest-neighbor vote achieves 86% accuracy — no fine-tuning, no GPU training, just the foundation model’s representations and a simple algorithm. The confusion matrix shows where the boundaries blur. The x axis shows the true label, the y axis the predicted. Ideally everything is on the diagonal.
What This Means
The takeaway isn’t that we’ve solved weld quality inspection – far from it. Much of the real damage in welds is internal and invisible to surface photography. The takeaway is about transferability and accessibility:
Foundation models transfer. A model trained on steel micrographs can organize, search, and classify macroscopic weld photographs without any modification. The visual representations it learned – texture, structure, edges, patterns – are more general than the specific domain it was trained on.
Representation learning is intuitive. You don’t need to understand backpropagation or transformer architectures to use these tools. Once a foundation model produces a representation, you can explore your data with maps, search it with queries, detect anomalies by density, and classify with a nearest-neighbor vote. These are concepts anyone with a materials science background can grasp and use.
Rapid feasibility studies matter. Before committing to a multi-year data collection and model development effort, a one-day experiment with an existing foundation model can tell you whether the signal is there. In this case, 86% accuracy with zero domain-specific training is a strong signal.
Get Involved
This work was carried out in the context of AID4GREENEST (Grant Agreement No. 101091912), a Horizon Europe project developing AI-powered tools for sustainable steelmaking.
If you’re interested in applying these approaches to your own materials data, here’s how to get involved:
MicrostructureDB is our platform for exploring and organizing microstructure data using these foundation models. We’re currently onboarding beta users – visit microstructuredb.com to sign up for the mailing list or reach out to us directly.
If you’re working on fatigue datasets and want to contribute to building shared resources, check out Ghent University’s FABER COST Action.
We’re also organizing an upcoming free industry workshop in Freiburg on MicrostructureDB and related data technologies. Seats are limited — send us a message on LinkedIn if you’d like to join.
Dr. ir. Michael Sluydts is CEO and Scientific Director of ePotentia, a Belgian scientific AI consultancy specializing in machine learning for materials science and industrial R&D.